Free text searches can be performed by entering key words like 'ATP liver' in the text field.
This will retrieve all entries containing the search terms (also if only appearing in the publication title).
More sophisticated searches can be performed using the 'Advanced Search' tab.
learn more
Advanced Search
enter search term(s) as free text (like Google)
press 'magnification glass' to start search
search results will be displayed below (scroll down ↓)
select entries (mark checkboxes)
if you want to export data, click the checkbox for each entry and finally click on the symbol in the upper right corner to proceed
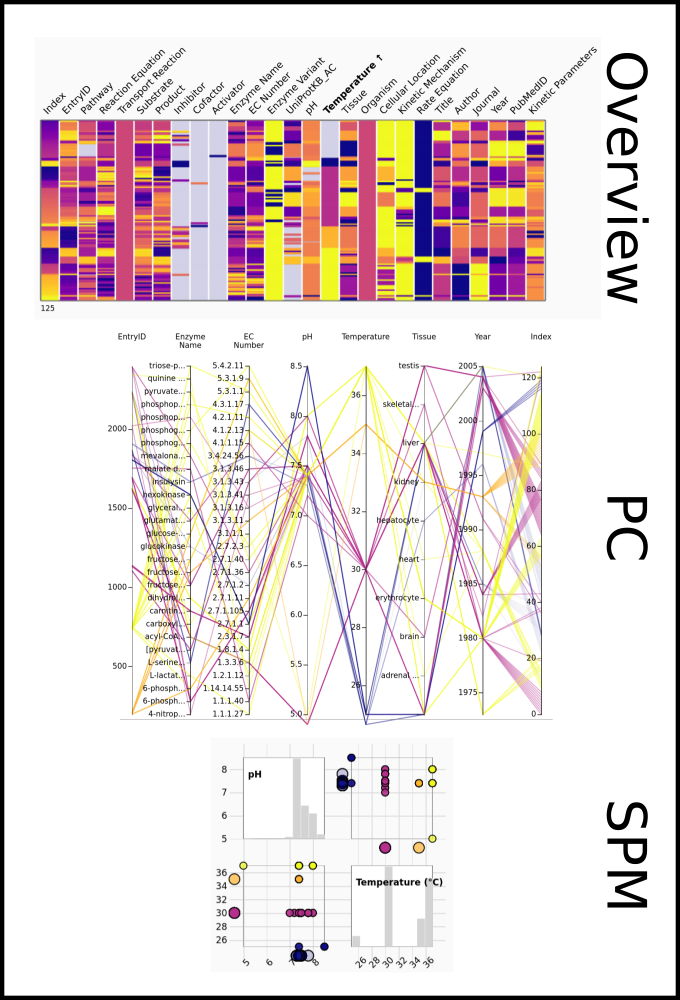
One line in Overview represents one entry in the database.
Click on the key/axis name to sort by that key. Hover over the heatmap to see the data values.
Select values by clicking on the heatmap area. Multiple categories or ranges are selected by brushing.
Overview visible axis/keys can be set in 'Visible Overview Axes' (click to open/close)
Selection on all graphs can be reset by using 'Reset Highlighting'.
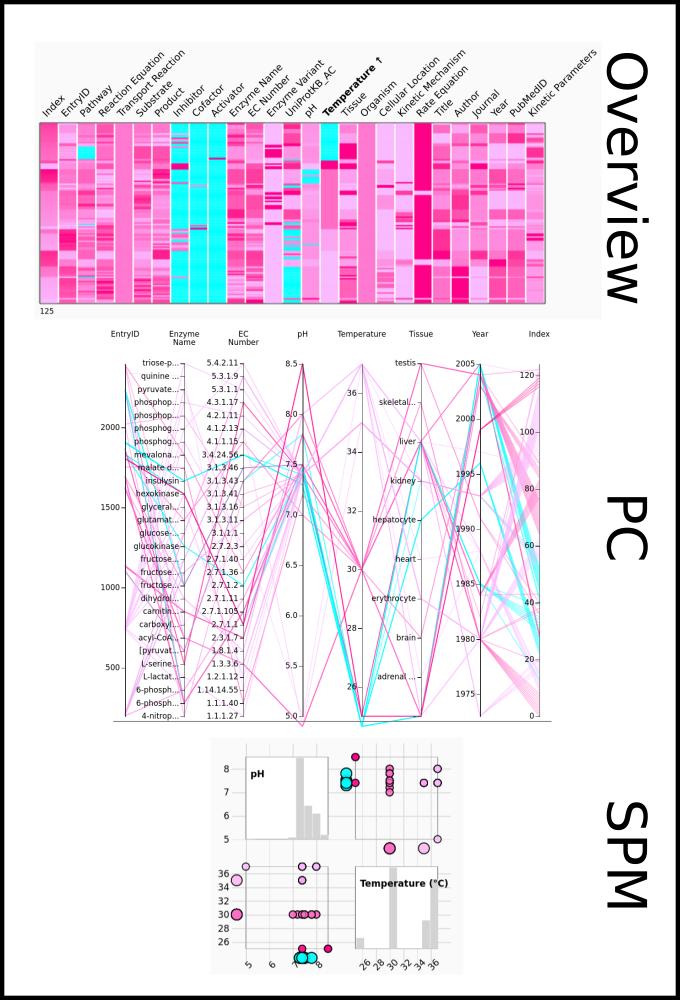
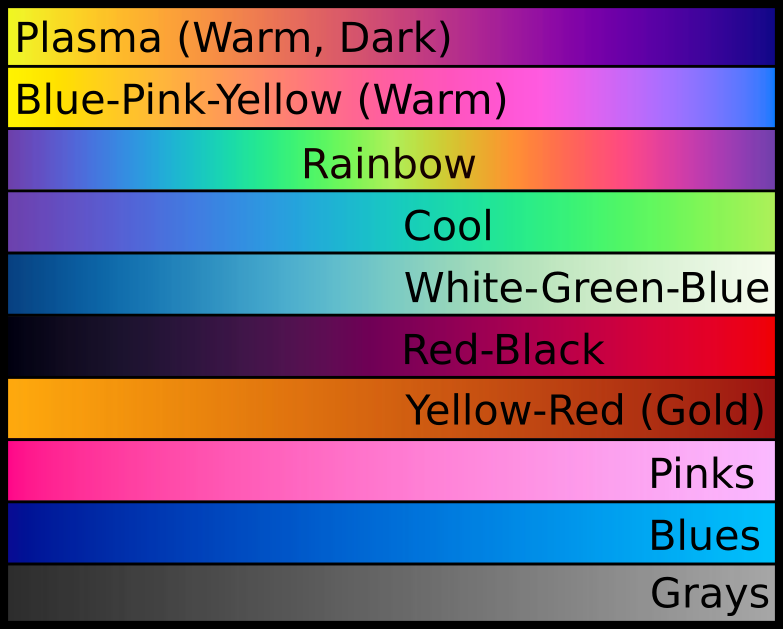
Selected color scheme (set in 'Color Scheme (PC, SPM, KPPC, KPSP)'): Plasma (Warm, Dark)
* Keys/axis take the appropriate selection from the whole color scheme (color legend can be seen when sorting by that key) e.g. two valued keys (e.g. Rate Equation) use the end colors of the color scheme while unique numerical keys (e.g. EntryID) use the whole color scheme.
* Overview shows the coloring by every key/axis (best seen when sorted by that axis/key). All other graphs (PC, SPM, KPPC, KPSP) use one single axis/key for coloring (chosen in 'PC, SPM: color by axis', 'KPPC, KPSP: color by axis').
* Non-existent values of a chosen key can be made more prominent by separately selecting their color in 'NULL ("-") value color (for all graphs)': Default (color scale minimum) selected
Allow More Data
Highlighted Data:
0
Axes:
Allowing only eight (seven plus Index) visible PC axis to prevent clutter.
SPM full matrix
Height of the PC and KPPC graphs is limited to 1200px. If the graph is larger some tick clutter might appear on the axes.
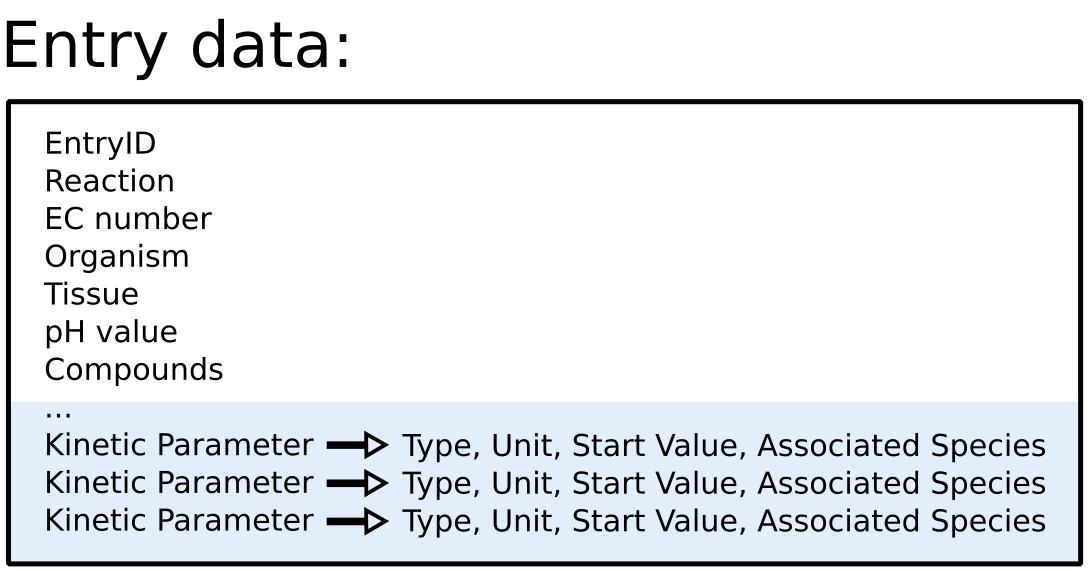
Kinetic Parameter Data:
Appearance:
Color Scheme (PC, SPM, KPPC, KPSP)
NULL ("-") value color (for all graphs)
The "null" color is visible if the data is sorted by the key that contains the null values.
PC, SPM: color by axis
KPPC, KPSP: color by axis
Various:
Parallel Coordinates (PC) of the Entry Data
Loading graph, please wait...
Brush the axis to select the data (supports multiple selections). Detailed numerical data values can be seen on Overview or SPM (or in the Entry View tab). PC visible axis/keys can be set in 'Visible PC Axes (max 8)'
PC colored by the key (set in 'PC, SPM: color by axis'):
Scatter Plot Matrix (SPM) of the Entry Data (numerical values only -> pH, Temperature, Year; kinetic data separately)
Loading graph, please wait...
Brush any of the scatter plots to select the data.
SPM visible axis/keys can be set in 'Visible SPM Axes'
SPM colored by the key (set in 'PC, SPM: color by axis'):
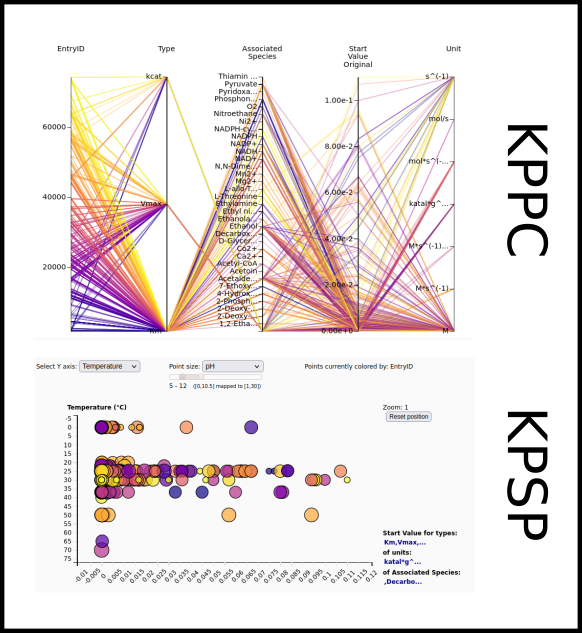
Kinetic Parameters
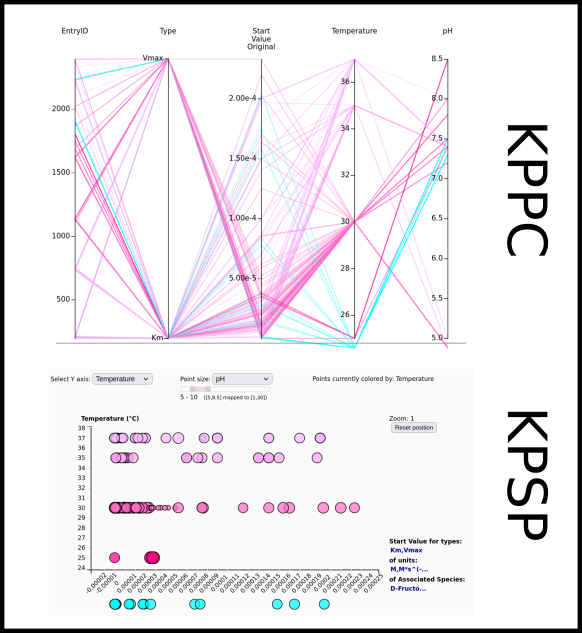
Parallel Coordinates (KPPC) of the Kinetic Parameters (plus temperature, pH) (each entry can have many parameters)
Loading graph, please wait...
Each entry can have multiple kinetic parameters that can be explored in the two graphs (KPPC, KPSP).
Brush the axis to select the data.
Detailed numerical data values can be seen on scatter plot KPSP (or in the Entry View tab).
KPPC visible axis/keys can be set in 'Visible KPPC Axes'
Currently showing types (set in 'Used Data Types'):
KPPC colored by the key (set in 'KPPC, KPSP: color by axis'):
KPPC, KPSP using the color scheme (set in 'Color Scheme (PC, SPM, KPPC, KPSP)'):
Use KPSP to see the parameter details.
KPPC local zoom status (allows detailed parameter space exploration not possible through the search):
Parameter data types have to be reselected on zoom out (set in 'Used Data Types'). Not all types are available when zoomed.
Search button will give you the entries with all of thier parameters. Limit the search locally first, by zooming and then selecting for the search. Not selecting anything before the search will give you the initial result.
Scatter Plot (KPSP) of the Kinetic Parameter Values (plus temperature, pH) (each entry can have many parameters)
Loading graph, please wait...
Points currently colored by:
KPSP currently showing: Start Value vs
KPSP serves as a addition of KPPC to see the parameter details (hover over point to see the values). Data can be zoomed and panned, but should be selected on KPPC.
Show/hide
First three graphs represent the general information for the database entries (Overview, PC, SPM).
Since each entry can contain several kinetic parameters, data space of the kinetic parameters can be separately explored (using KPPC and KPSP). Last two graphs offer more details about the kinetic parameters (KPPC, KPSP) belonging to the entries and an option to explore through their data space.
A number of entries is obtained as a result of a search.
Select/highlight the subset of the data on one of the graphs. Number of highlighted data and the used attributes are visible on the top right side of the visualization tab (as is the number of the selected kinetic parameters).
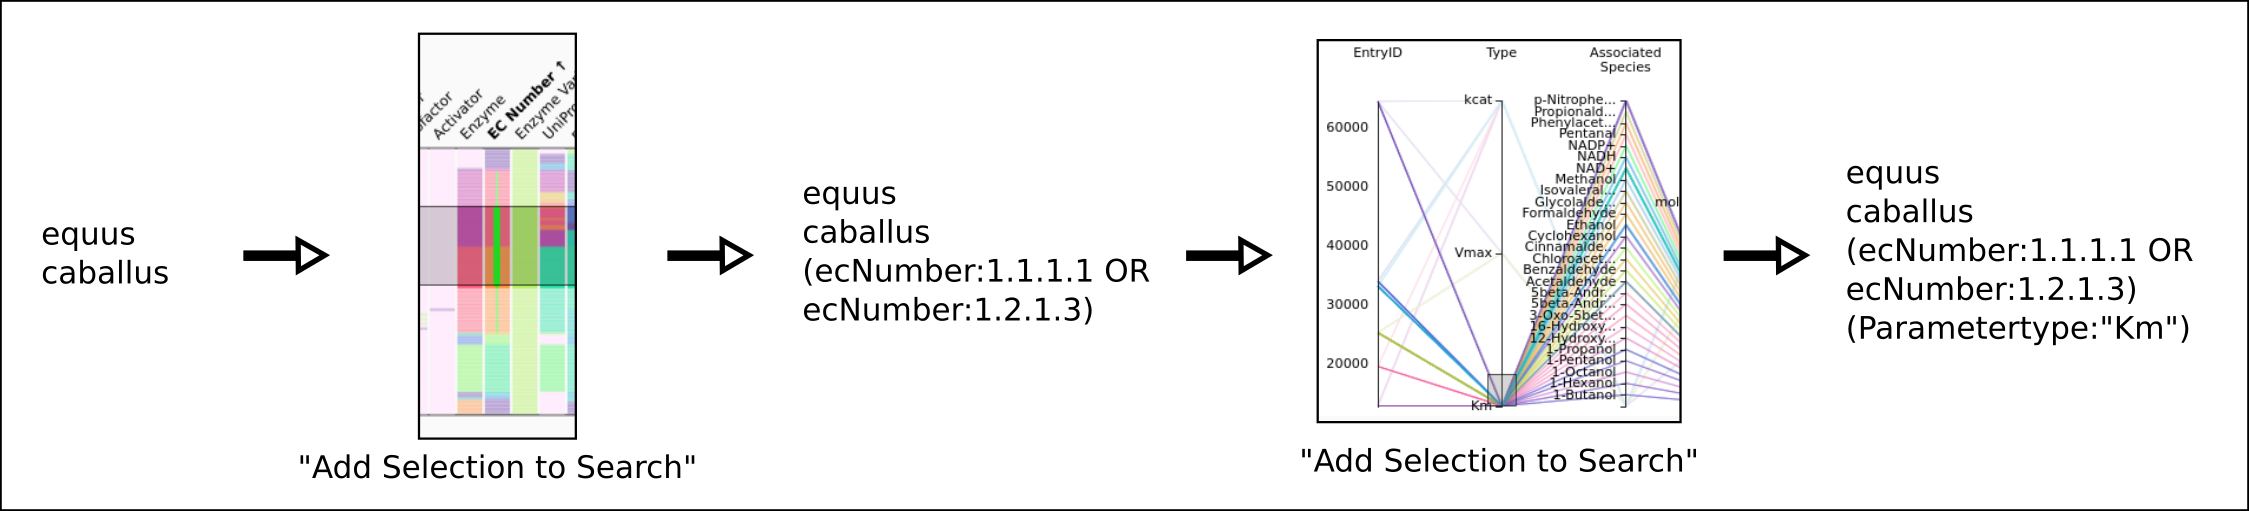
By clicking on "Add Selection to Search" search is performed applying the selected criteria (highlighting) on the resulting data, thus refining the search. E.g.
If the current search query is a refinement of the previous query "Use Previous Query (Go Back)" button can be used to perform the previous query again. Only one automatic step back is possible, but the query can be manually manipulated if desired.
The graphs can be manipulated and the data highlighted in the following ways:
Overview of the resulting data entries is given in the heat map:
* Sort per column (upwards, downwards) by clicking on the attribute's title, hold the "shift" key and drag the column to rearrange columns.
* Show/hide columns using Visible Overview Axes.
* Highlight individual values by clicking.
* Highlight ranges by brushing (range of the sorted column, marked with a green line).
* While brushing, the thin green line (extending from the thick one) shows the full range of the selected categories.
Parallel Coordinates (PC):
* Sort axis by double clicking on the axis title, rearrange axes by dragging.
* Show/hide axes using Visible PC Axes (maximum 7 in addition to the Index axis).
* Highlight ranges by brushing on different axes (more ranges on a single axis are possible).
* Height of the PC graph is determined by the data, but limited (has minimum and maximum height). If the graph should be larger than the maximum height some tick clutter might appear on the axes.
* Numerical axes (e.g. pH and Temperature) have their null values shown below the line unlike categorical axes (like UniprotID) that have the null value or "-" as a category on the axis.
Scatter Plot Matrix (SPM):
* Show/hide attributes (numerical ones) using Visible SPM Axes.
* Highlight range by brushing on one of the scatter plots.
* Histograms show the attribute value frequency (divided into 10 bins/columns).
* Full SPM matrix can be shown.
* Details about the point values can be seen on a tooltip when hovering above the point.
* Points with no value ("-") are shown on the left side or under the axis.
* If only points with no value ("-") are present, they are shown under or left of the zero line on the bottom/left of the respective image.
* Lower tick values are valid for the histogram graphs while ticks on the left (plus the lower ones) are only valid for the scatter plots in the matrix.
Kinetic Parameter Parallel Coordinates (KPPC):
* EntryID axis on KPPC connects the kinetic parameters with the other graphs: each parameter belongs to an entry. One entry can have more parameters.
* Sort axis by double clicking on the axis title, rearrange axes by dragging.
* Show/hide axes using Visible KPPC Axes (Type and EntryID are always visible).
* Highlight ranges by brushing on different axes (single range possible on a single axis).
* Select shown kinetic parameter data type by selecting Used Data Types (must be at least one).
* Types are preselected on search giving types: Km, Vmax, kcat as default (if present). The user can view any other type by selecting it in the GUI.
* Currently selected types are stated below the graph.
* Start Value Original axis shows the original values of the parameter.
* Start Value Log axis is a logarithmic axis (since the original range of the shown values can be huge). The original range can be seen in Brush Info Kinetic Parameters PC.
* Graph can be searched locally by using the Zoom in / Zoom out buttons.
* Once the desired values are narrowed down (and selected on the KPPC) they can be searched by using the "Add Selection to Search" button.
* the kinetic parameter search query uses the selected keywords (where available) e.g. ParameterType, AssociatedSpecies.
* where no keywords are available the kinetic parameter search query uses entryIDs.
* the result of the search gives full entries (meaning resulting parameter data is bigger than the selection).
* Height of the KPPC graph is determined by the data, but limited (has minimum and maximum height). If the graph should be larger than the maximum height some tick clutter might appear on the axes.
* For convenience, KPPC can also show temperature and pH values and the axis can also be colored by those values.
* Numerical axes (e.g. pH and Temperature) have their null values shown below the line unlike categorical axes that have the null value or "-" as a category on the axis.
Scatter Plot of the Kinetic Parameter Values (KPSP):
* Scatter plot is showing the values of the "Start Value Original" vs "Temperature", "pH" or "EntryID" values.
* The user can choose values on the y axis using the dropdown menu ("Temperature", "pH" or "EntryID") above the graph.
* The user can choose the axis used for the point size using the dropdown menu ("Uniform", "Temperature", "pH" or "EntryID") above the graph. Point size is interpolated between a set range (size 5 to 10). Larger range [1,30] can be set by using the range slider. Uniform size is size 5 (no range slider).
* The user can choose the kinetic parameter types of the shown values in the GUI using "Used data types" (the graph updates accordingly).
* Graph can be zoomed and panned by using the computer mouse or touchpad.
* Viewed data points can again be centered by pressing the Reset position button (zoom value is seen above the button).
* Details about the point values can be seen in a tooltip when hovering above the point.
* Points with no value ("-") are shown under the axis.
* If only points with no value ("-") are present, they are shown under the zero line.
* Used data types, their units and associated species are visible on the Start Value axis label (all can be seen in a tooltip when hovering above with the mouse pointer).
* Corresponding data is highlighted when selecting data on any of the other graphs.
* Data cannot be selected on this graph. The graph responds to the selection on the KPPC.
* Details about selection (made on KPPC) can be viewed below in the Brush Info section.
Additional Information:
* Highlighting data entries on one of the graphs (Overview, PC, SPM) highlights the same data on all other graphs (and their parameters on KPPC, KPSP).
* Highlighting kinetic parameter data on KPPC graph highlights the matching entries on other graphs (Overview, PC, SPM, KPSP). Each parameter belongs to an entry. One entry can have more parameters.
* Details about selection can be viewed below in the Brush Info section.
* Reset highlighted values by using "Reset Highlighting".
* Index attribute is only the sequential numbering of the result and cannot be used for further searching.
* Color:
* Different color schemes for the graphs can be selected (see image).
* Overview uses the full range of the color scheme for each of the attributes.
* Which attribute is used for coloring PC and SPM axes can be manually selected, otherwise it changes upon sorting columns in Overview.
* Which attribute is used for coloring KPPC axes (and KPSP) can also be manually selected (and does not change upon sorting columns in Overview).
* Color of the null values can be selected by using the "NULL ("-") value color" in the GUI. Default color is the faded minimum color of the chosen color scheme. Users can select another color that offers more contrast and visibility in combination with the chosen color scheme (red, green, blue, cyan, magenta, yellow, black). When changing the used color scheme the null color is reset to the default color for that scheme (faded minimum color). Note that coloring ("PC, SPM: color by axis") or sorting the Overview (and hence coloring PC and SPM) by a certain key/axis (containing the null values), makes the null values nicely visible on the PC and SPM graphs. For the null value color to be visible on the KPPC and KPSP graphs, they need to be colored by that key/axis ("KPPC, KPSP: color by axis").
* Screenshots of the produced graphs can be downloaded together with the solr search expression.
* Hovering with a pointer over a shortened tick name (three dots) shows the full name.
* Temperature is given in degrees Celsius (°C).
* Overview currently shows maximum 10000 data, PC and SPM maximum 400 (to not over clutter). The data limit for PC and SPM can be turned off by ticking "Allow More Data" in the GUI. This option only appears if the number of data entries is between 400 and 10000.


 If the current search query is a refinement of the previous query "Use Previous Query (Go Back)" button can be used to perform the previous query again. Only one automatic step back is possible, but the query can be manually manipulated if desired.