
News
New Visualization in SABIO-RK
09-29-2022
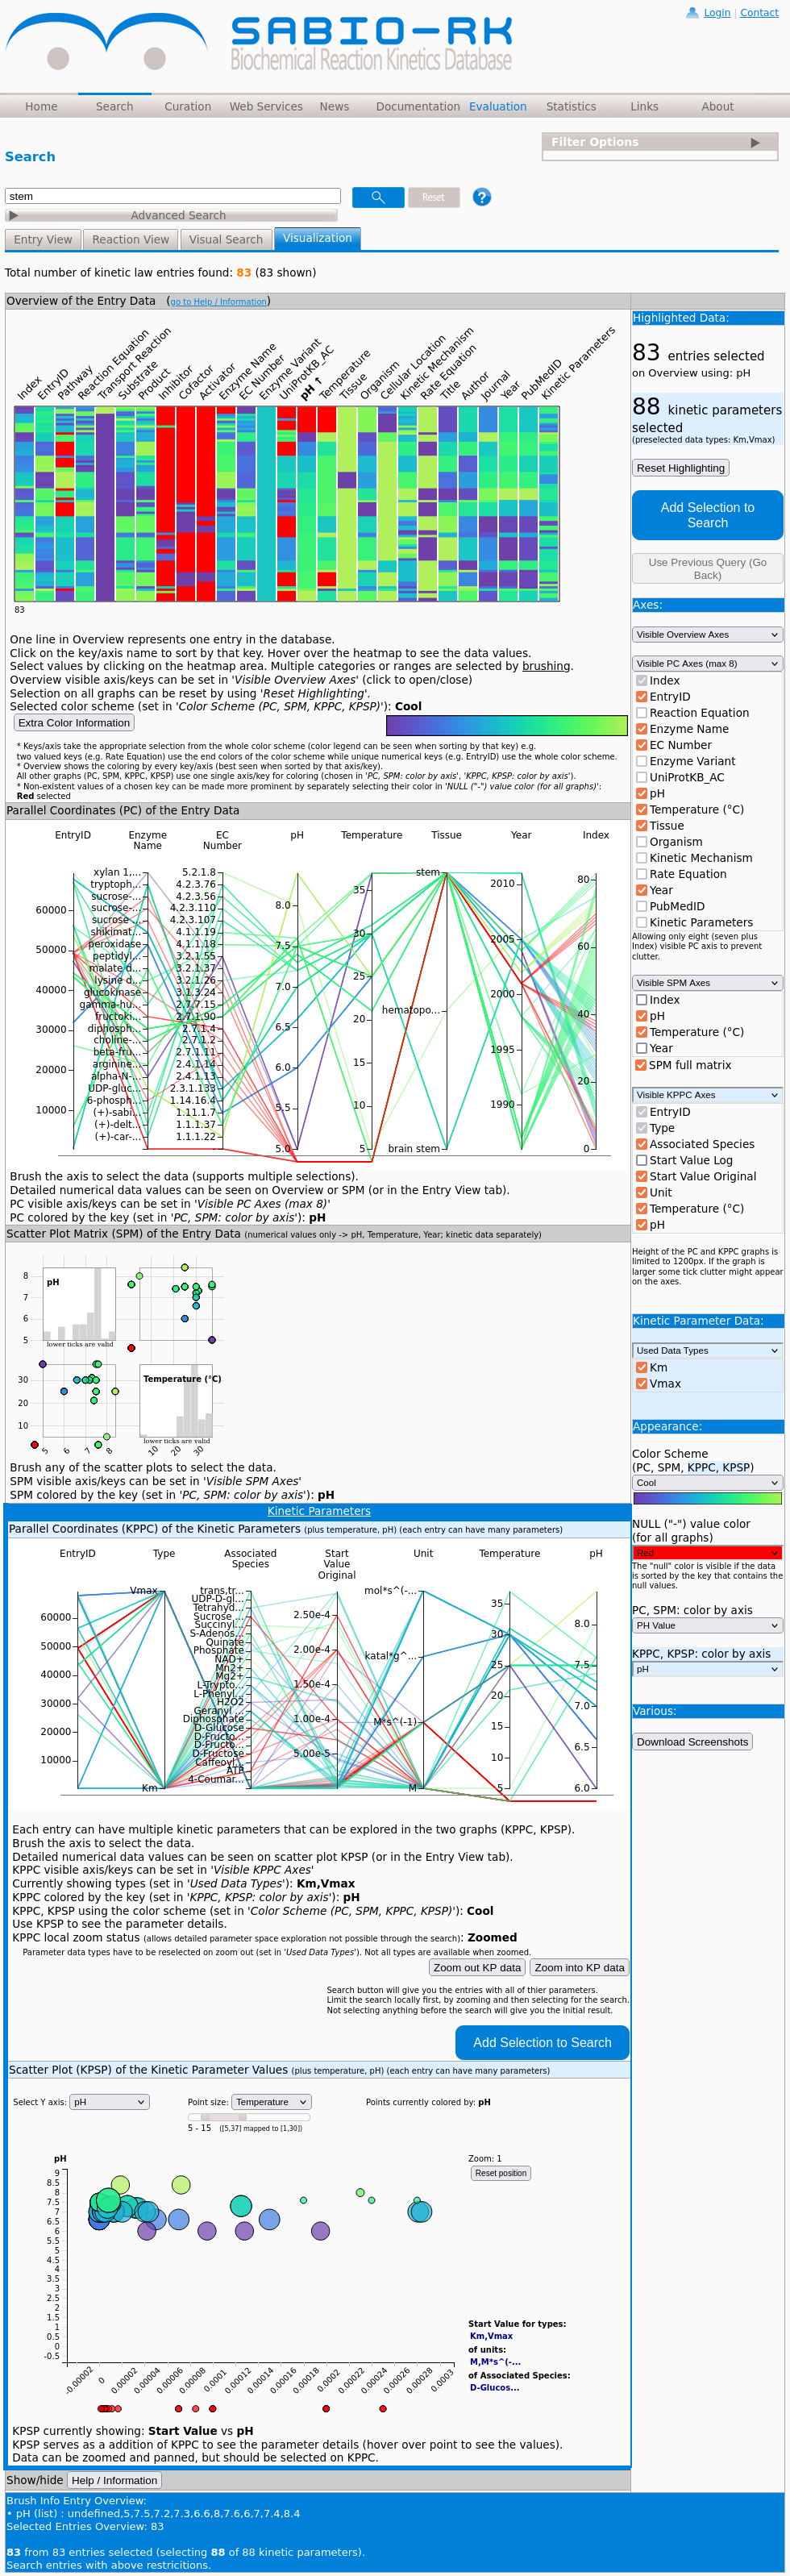
In order to facilitate interactive search and data refinement through the SABIO-RK
data, a new visualization module is developed. Its goal is to improve the
understanding of the database content and detect possible discrepancies between
kinetic parameters from different publication sources. It is meant to support both
modellers and experimentalists to extract the highest possible amount of information
from accumulated and orderly presented data. Clustering and grouping of the data
(e.g. kinetic parameters, EC numbers, environmental conditions) is implemented.
Reactions, proteins/enzymes, organisms, tissues and experimental conditions (pH
and temperature) are included within three different visualization concepts
representing a heat map overview, parallel coordinates and a scatter plot matrix with
histograms. Since each database entry can contain several kinetic parameters (with
its types, values, units and associated species) they are shown in two separate
visualizations. This improves the possibilities of exploring the kinetic data and its
connections to the rest of the data in SABIO-RK. Data can be visually adjusted by
determining what exactly is shown within the graphs, by reordering the data and by
selecting different color schemes for the visualizations using the user interface.
The new visualizations enable navigating through the database without the need to
know much about available keywords in the database or about manually composing
search queries.